
Troubleshooting SQL Database Timeout Issues
Explore a troubleshooting technique for SQL databases, focusing on identifying and resolving timeout issues. Learn about query performance insights, execution plans, and the importance of database statistics.
In this guide, we'll learn how to troubleshoot SQL database performance issues, specifically focusing on identifying and optimizing poorly performing queries. By investigating SQL errors with timeout issues reported through AppInsights, we aim to enhance the database's efficiency.
Investigating SQL Database Performance
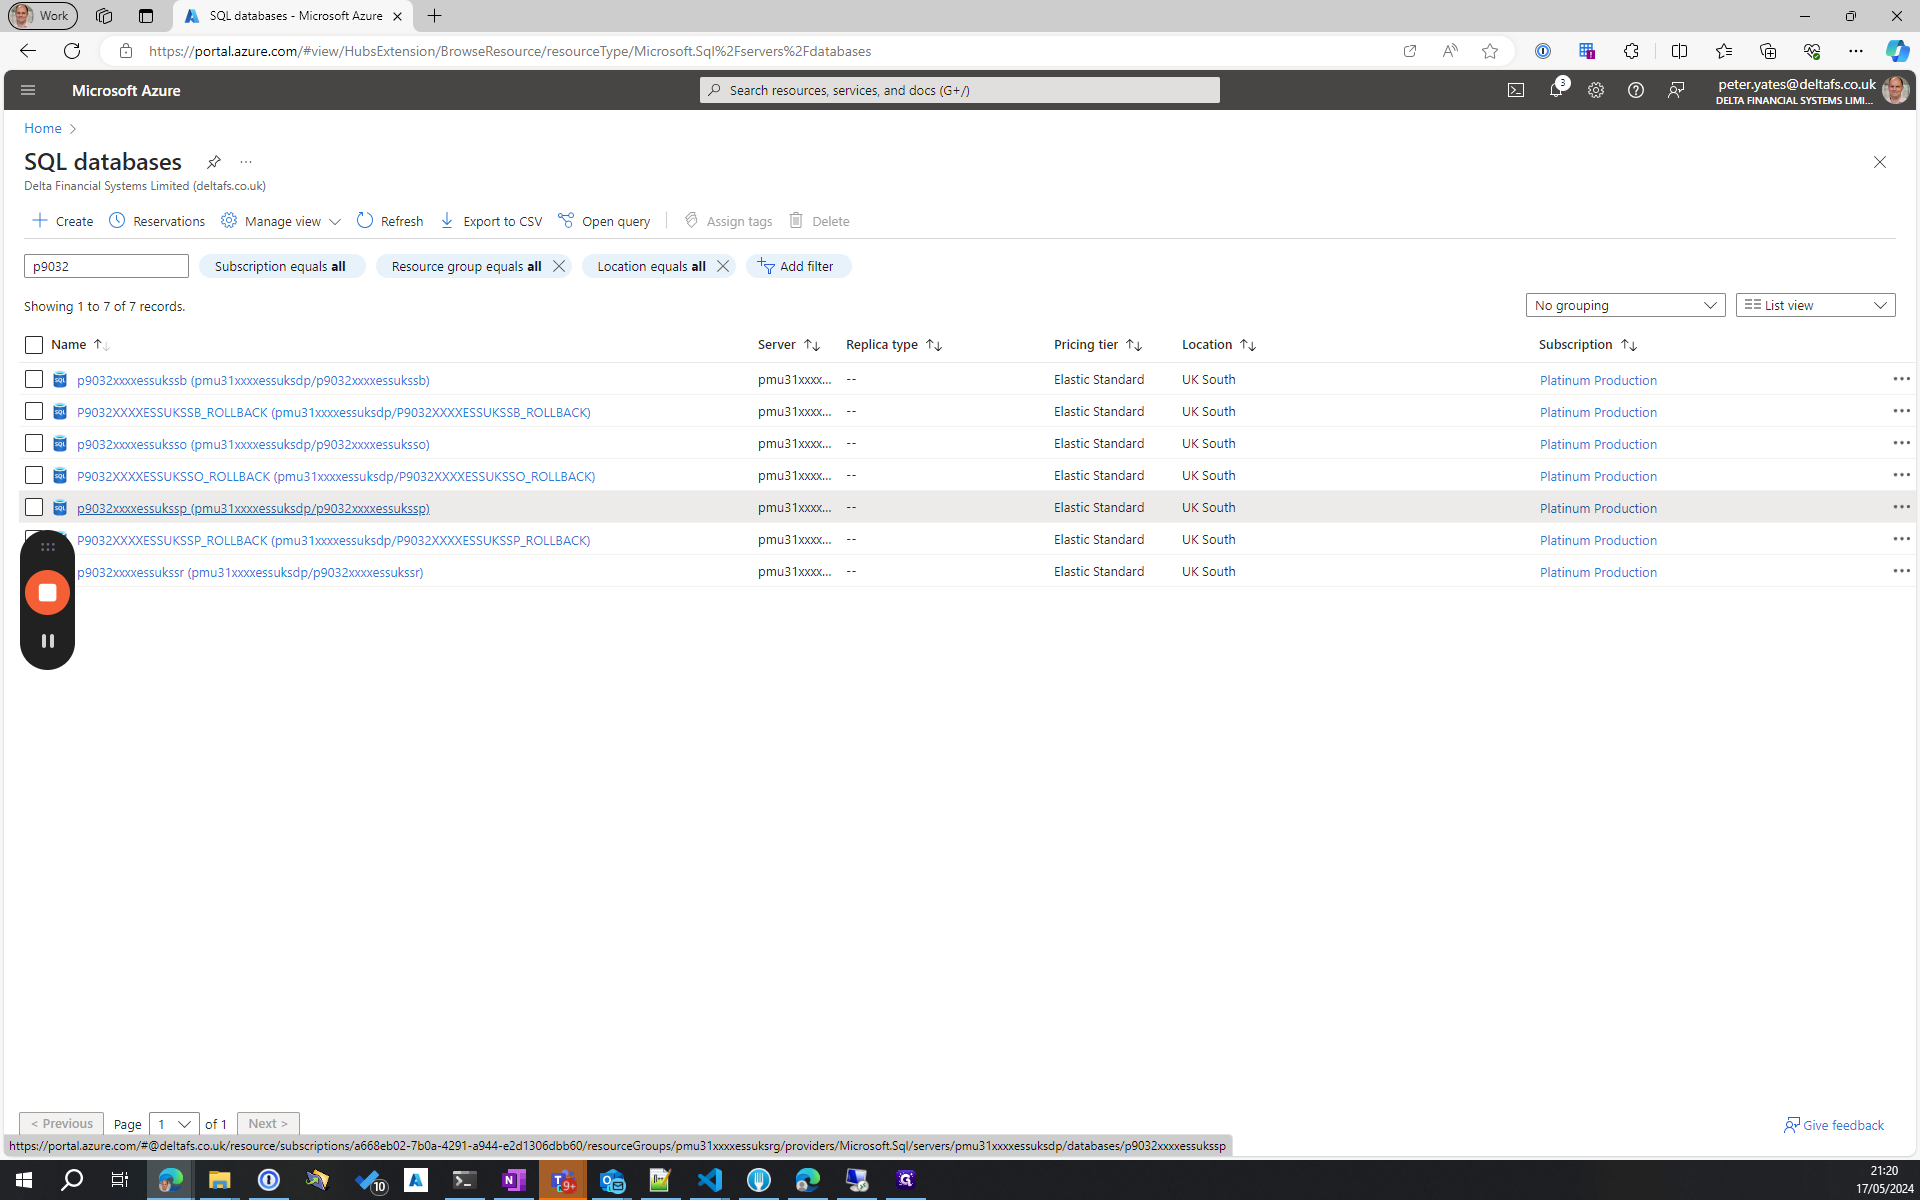
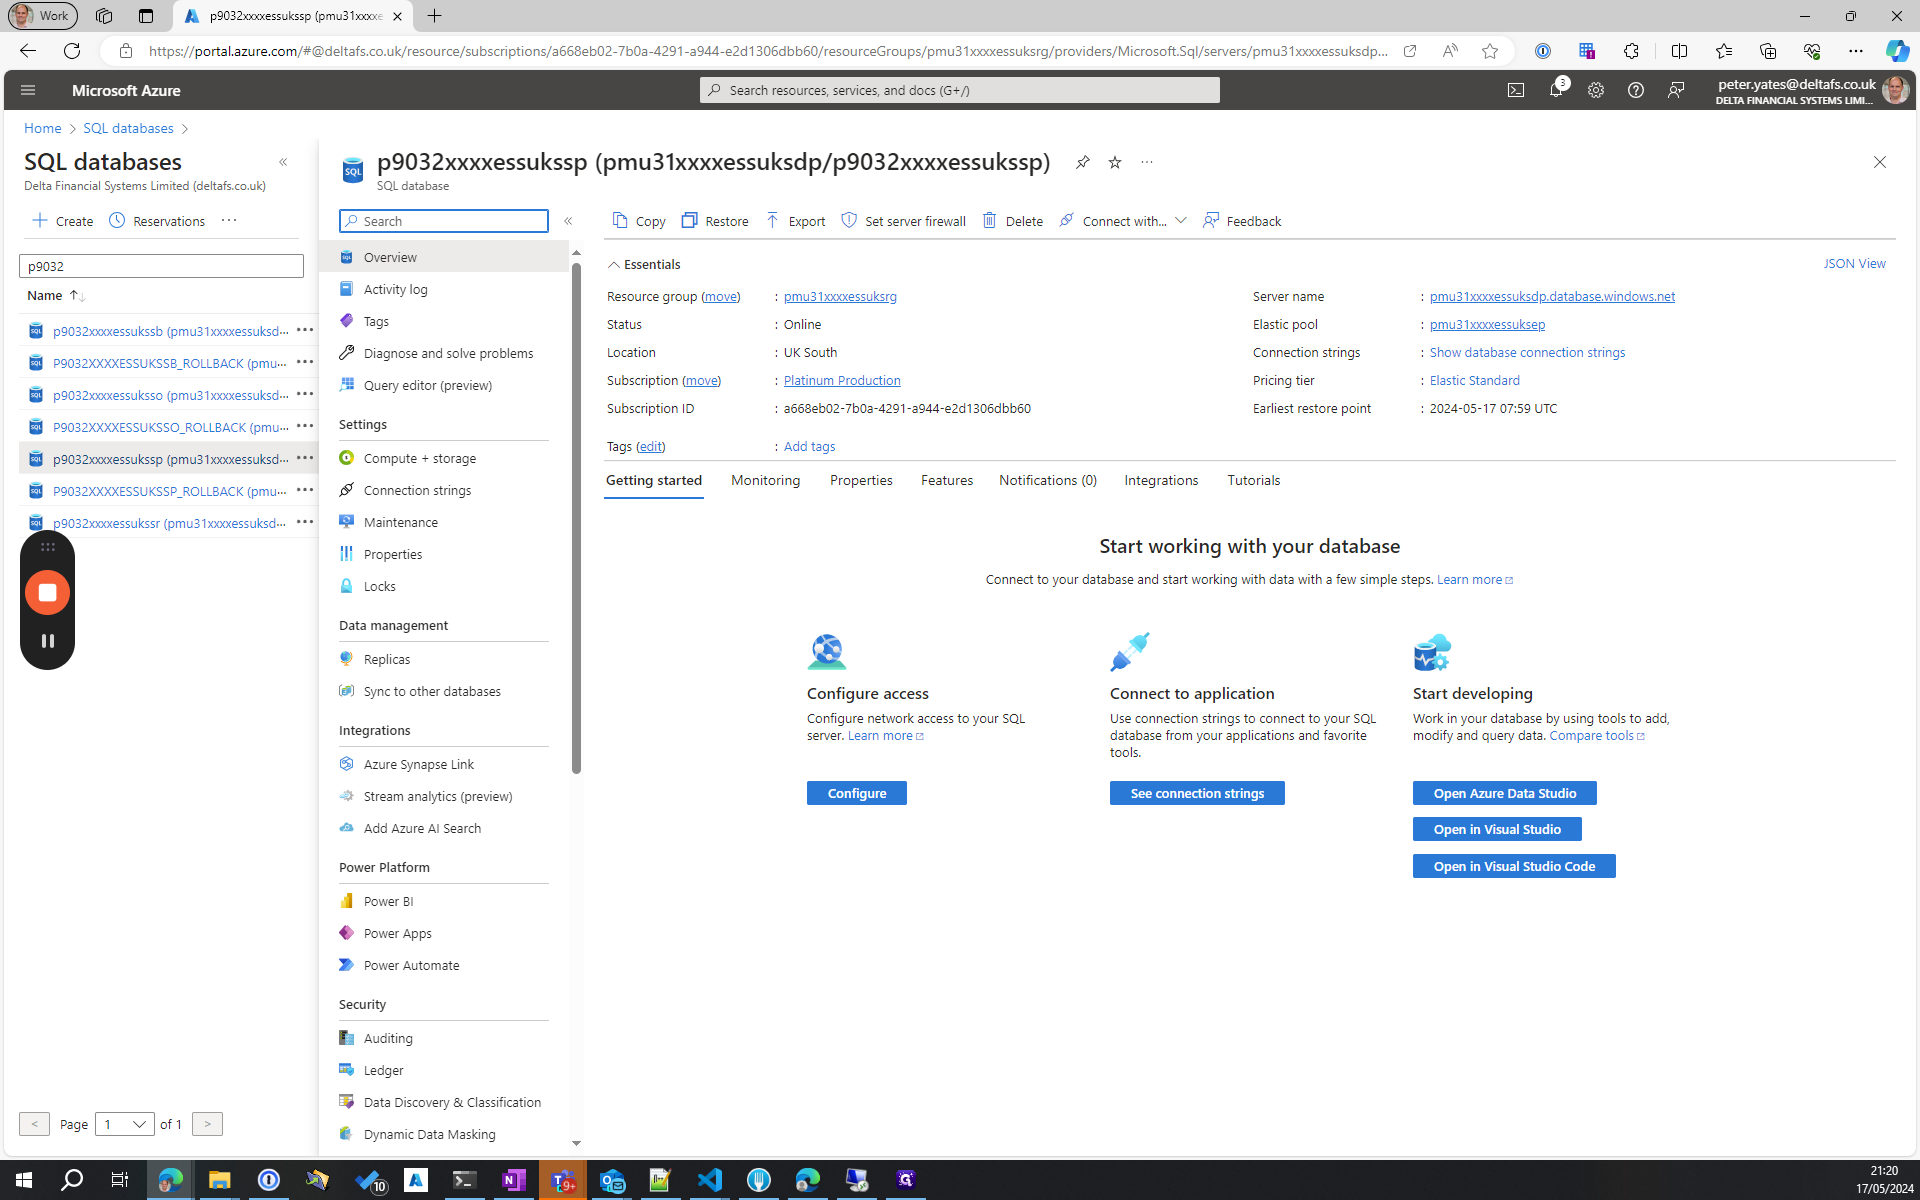
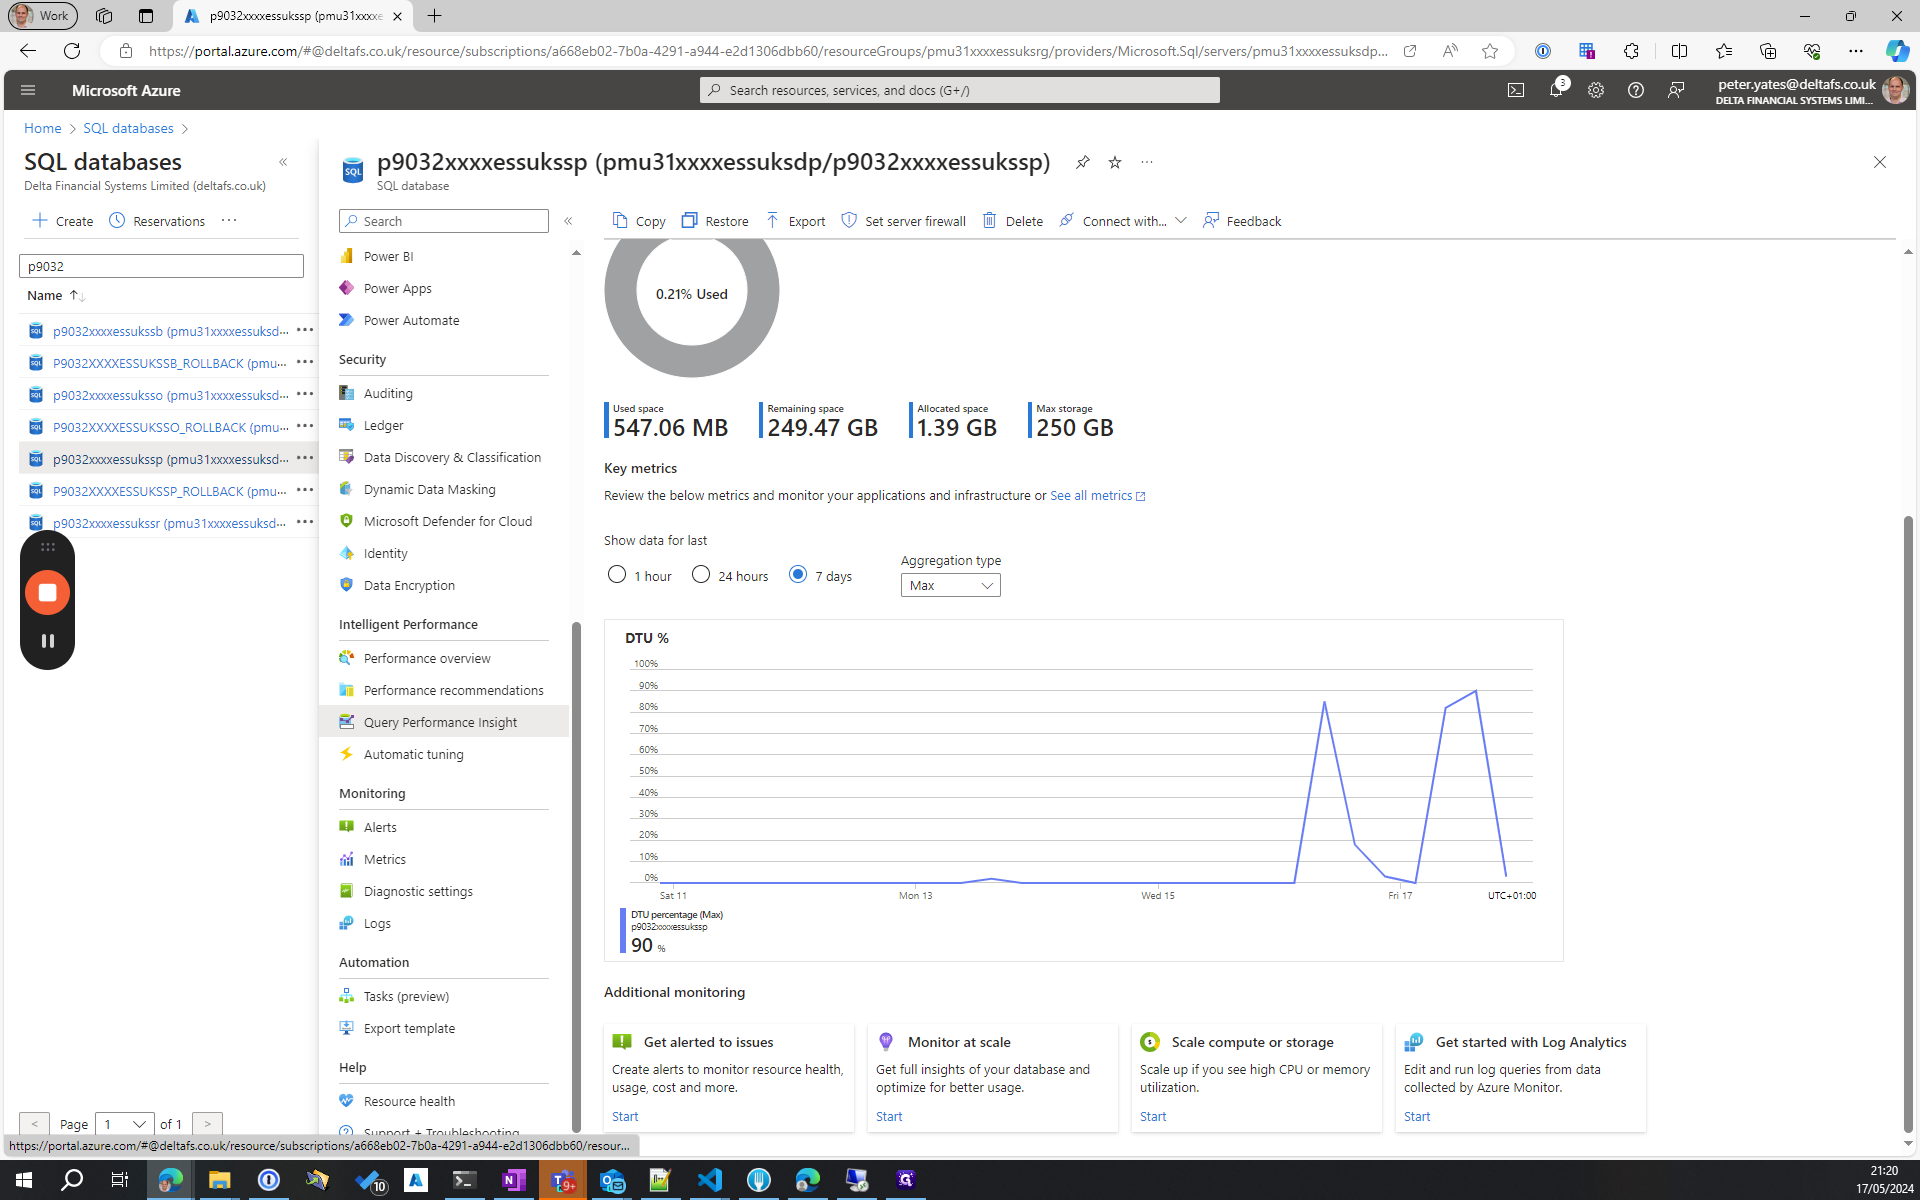
To begin, we'll delve into the SQL database for Platinum instance ProductionSupport32 to address the high DTU percentage observed recently.
Analyzing Query Performance Insights
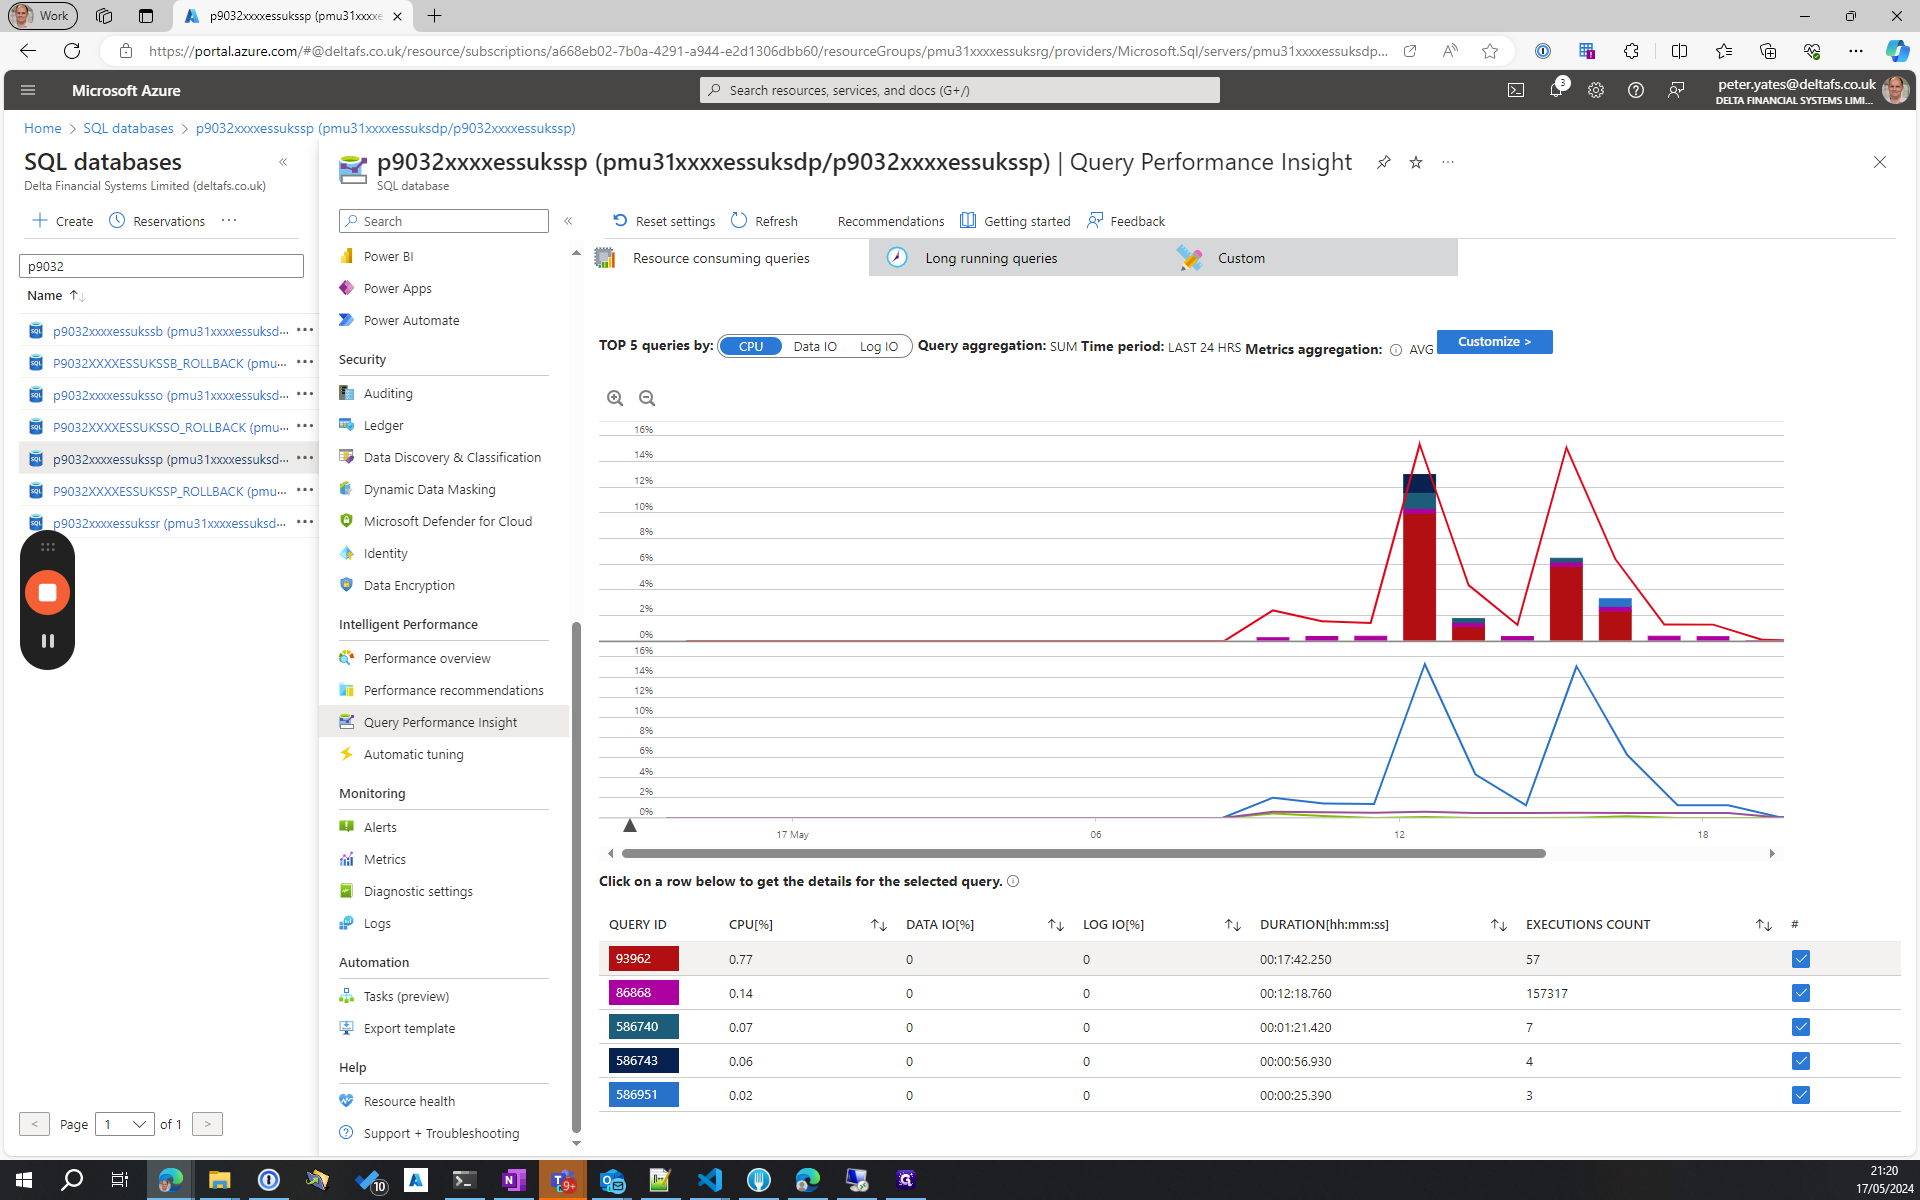
We'll explore the query performance insights to pinpoint the top five worst-performing queries over the last 24 hours. By examining the execution counts and durations, we can isolate the problematic queries.
Optimizing Query Execution
We'll then focus on executing and analysing the identified queries to uncover any performance bottlenecks. By reviewing the execution plans and addressing warning signs like columns with no statistics, we aim to enhance query efficiency.
Let's get started.
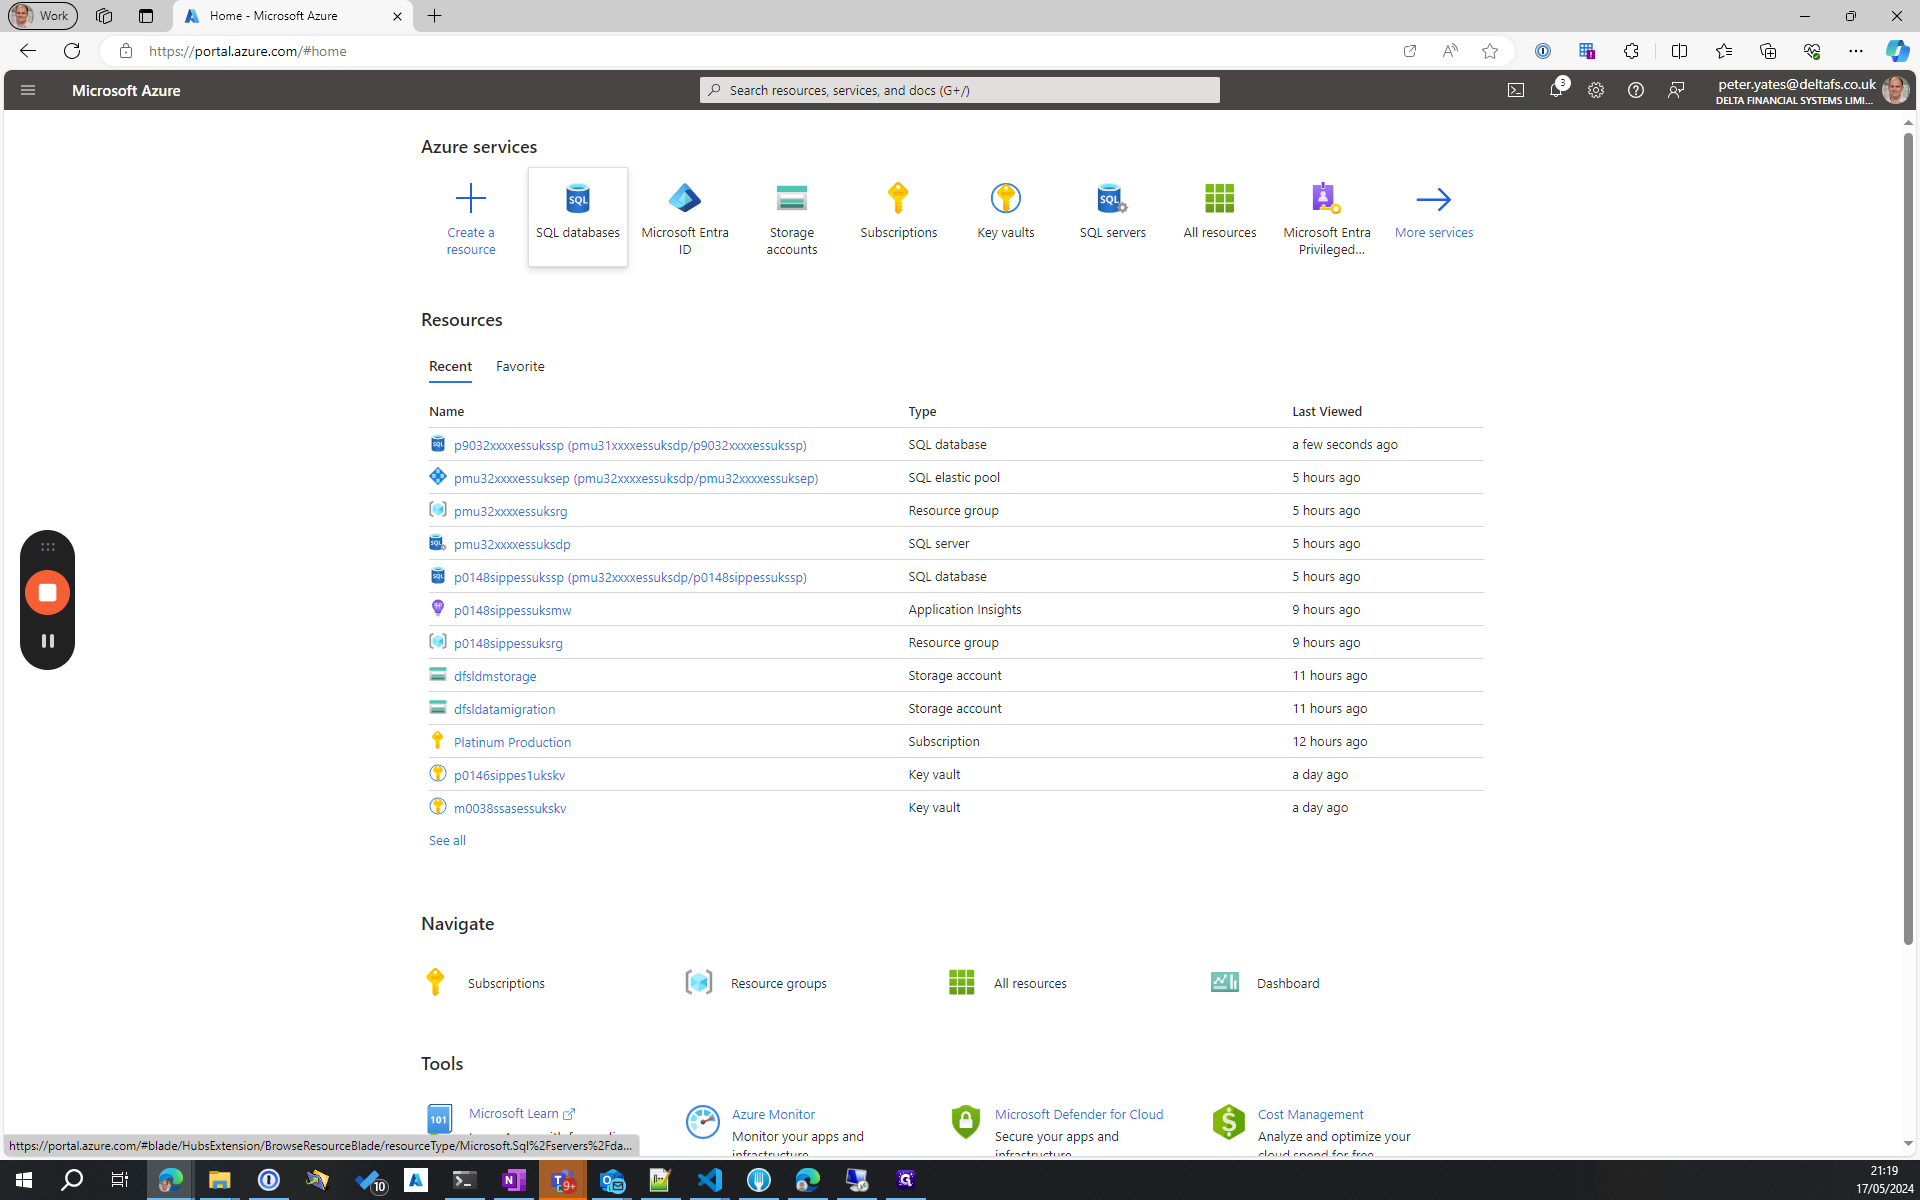
We will explore a troubleshooting technique for SQL databases. A client reported plugman errors, and upon checking AppInsights, we identified SQL errors related to timeout issues. Let's delve into the SQL database to investigate further. To begin, access the SQL databases.
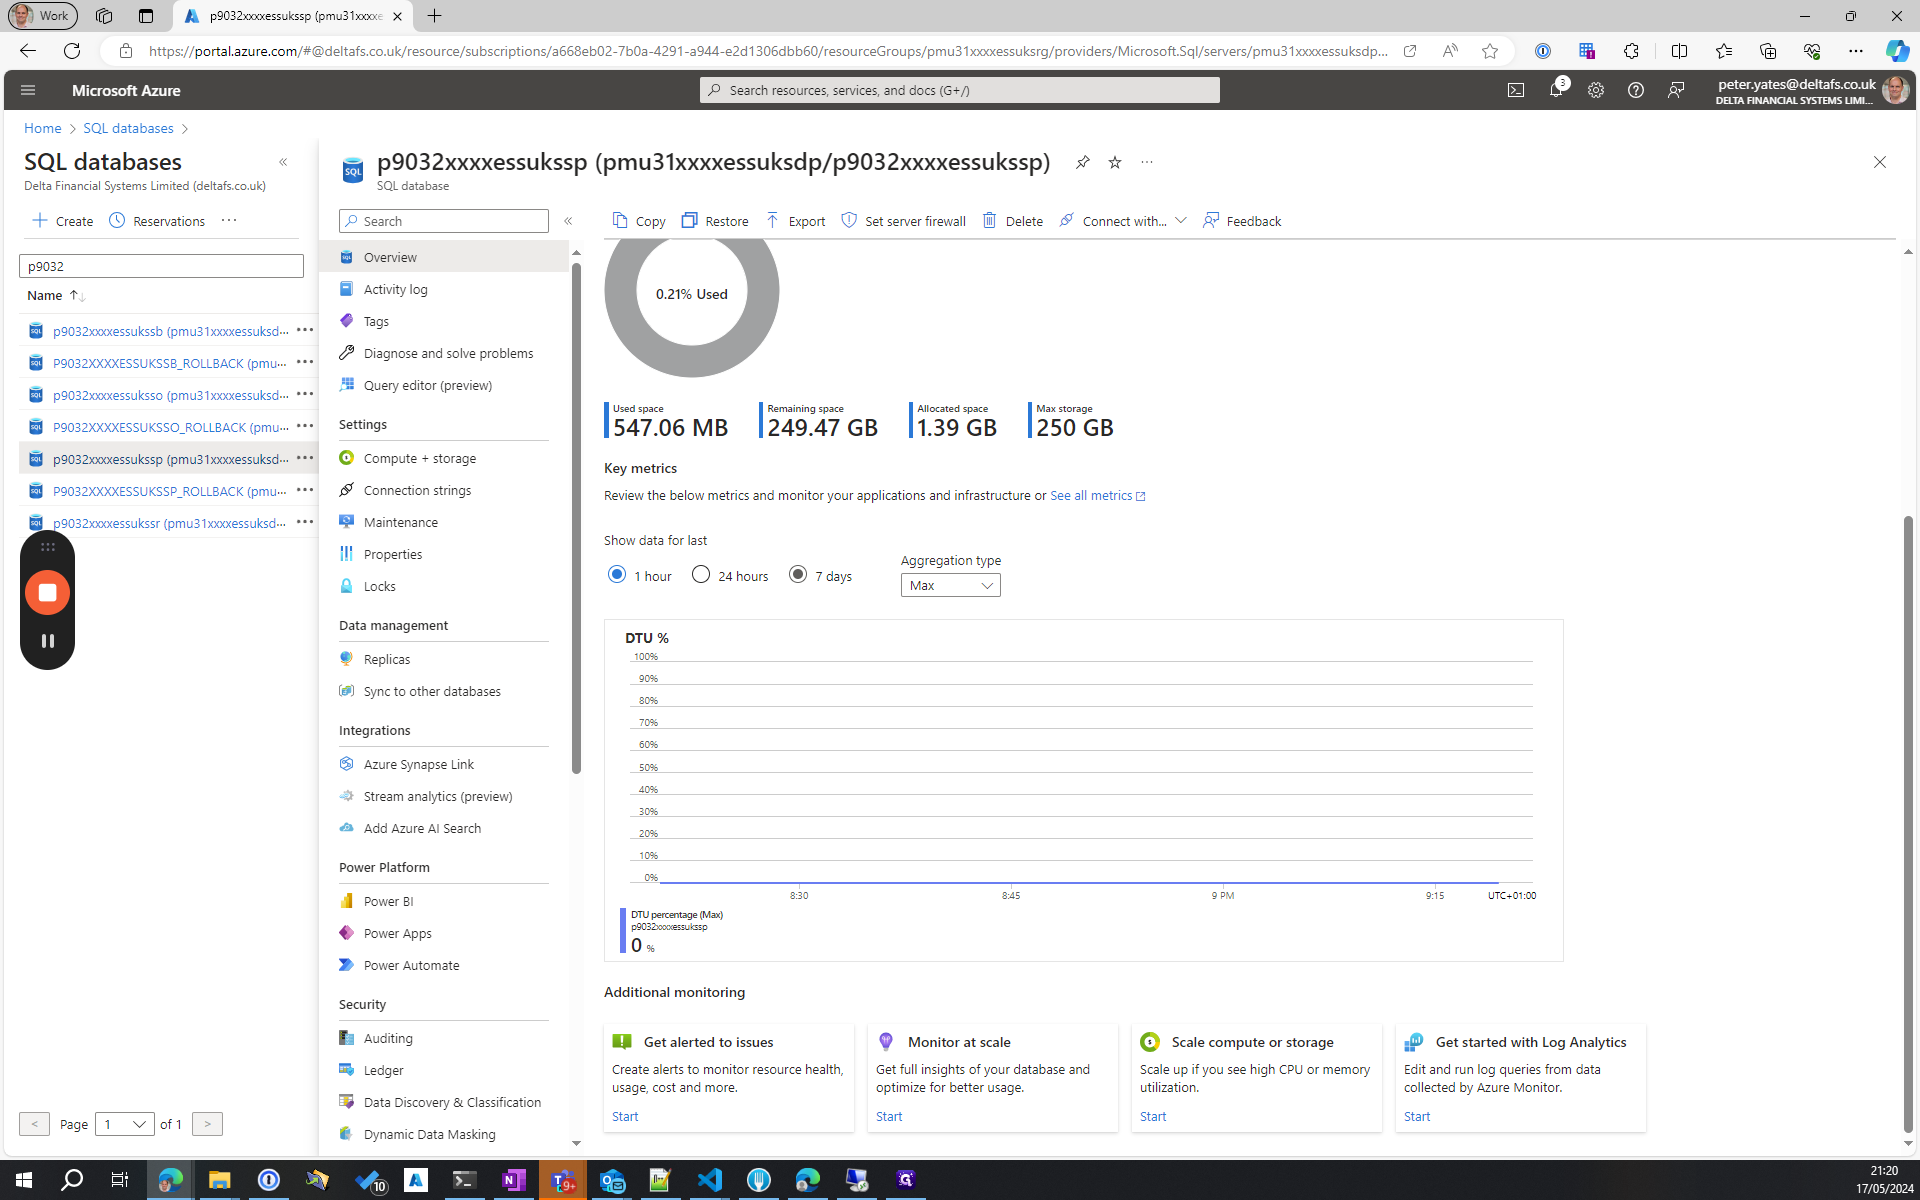
When I check the monitoring tab and view it for the last few days, I can see high DTU percentage in the last day.
We will now explore query performance insights.
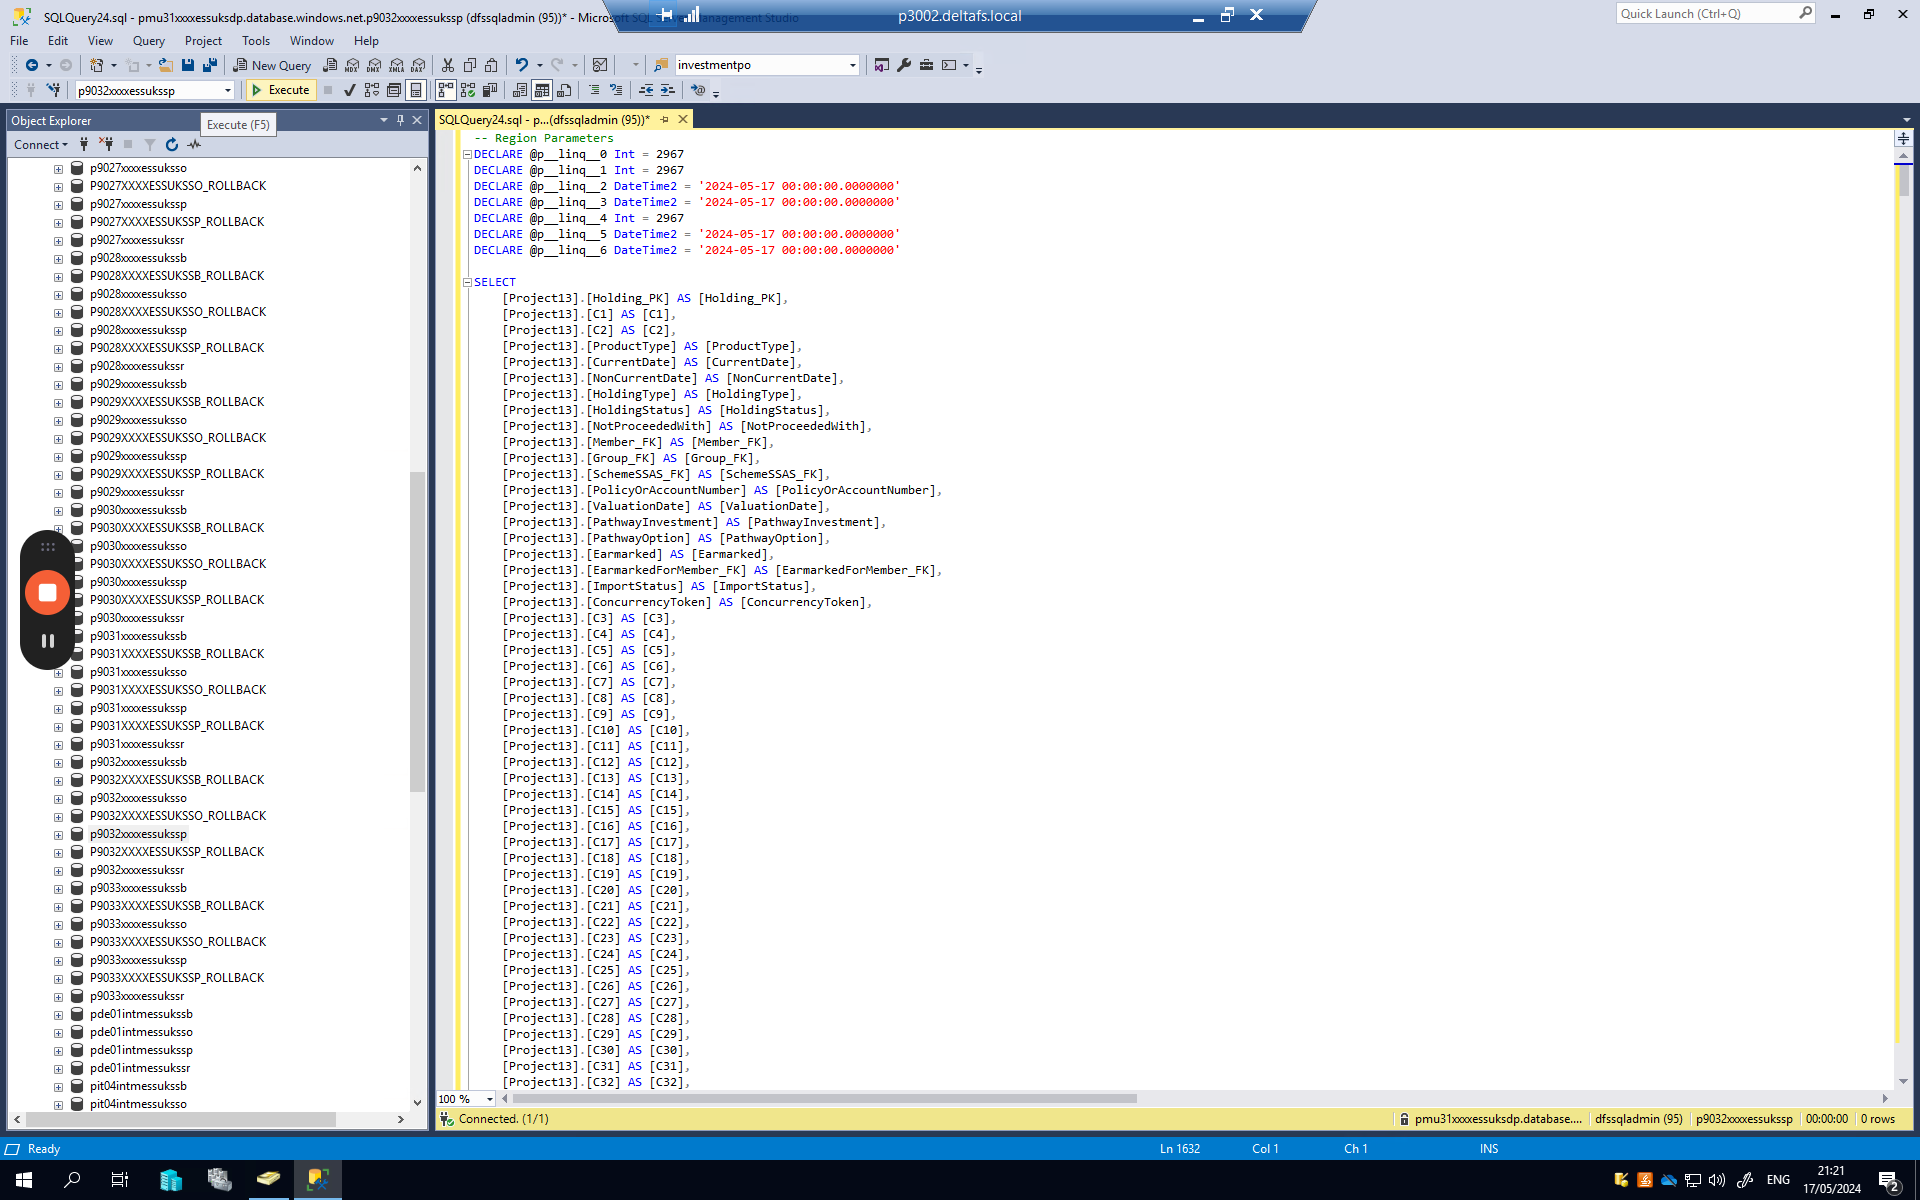
This will show us the top five worst-performing queries from the last 24 hours. The first query has been executed 57 times, taking a total of 17 minutes. Click on the query ID to view the query and analyze its execution plan for performance issues.

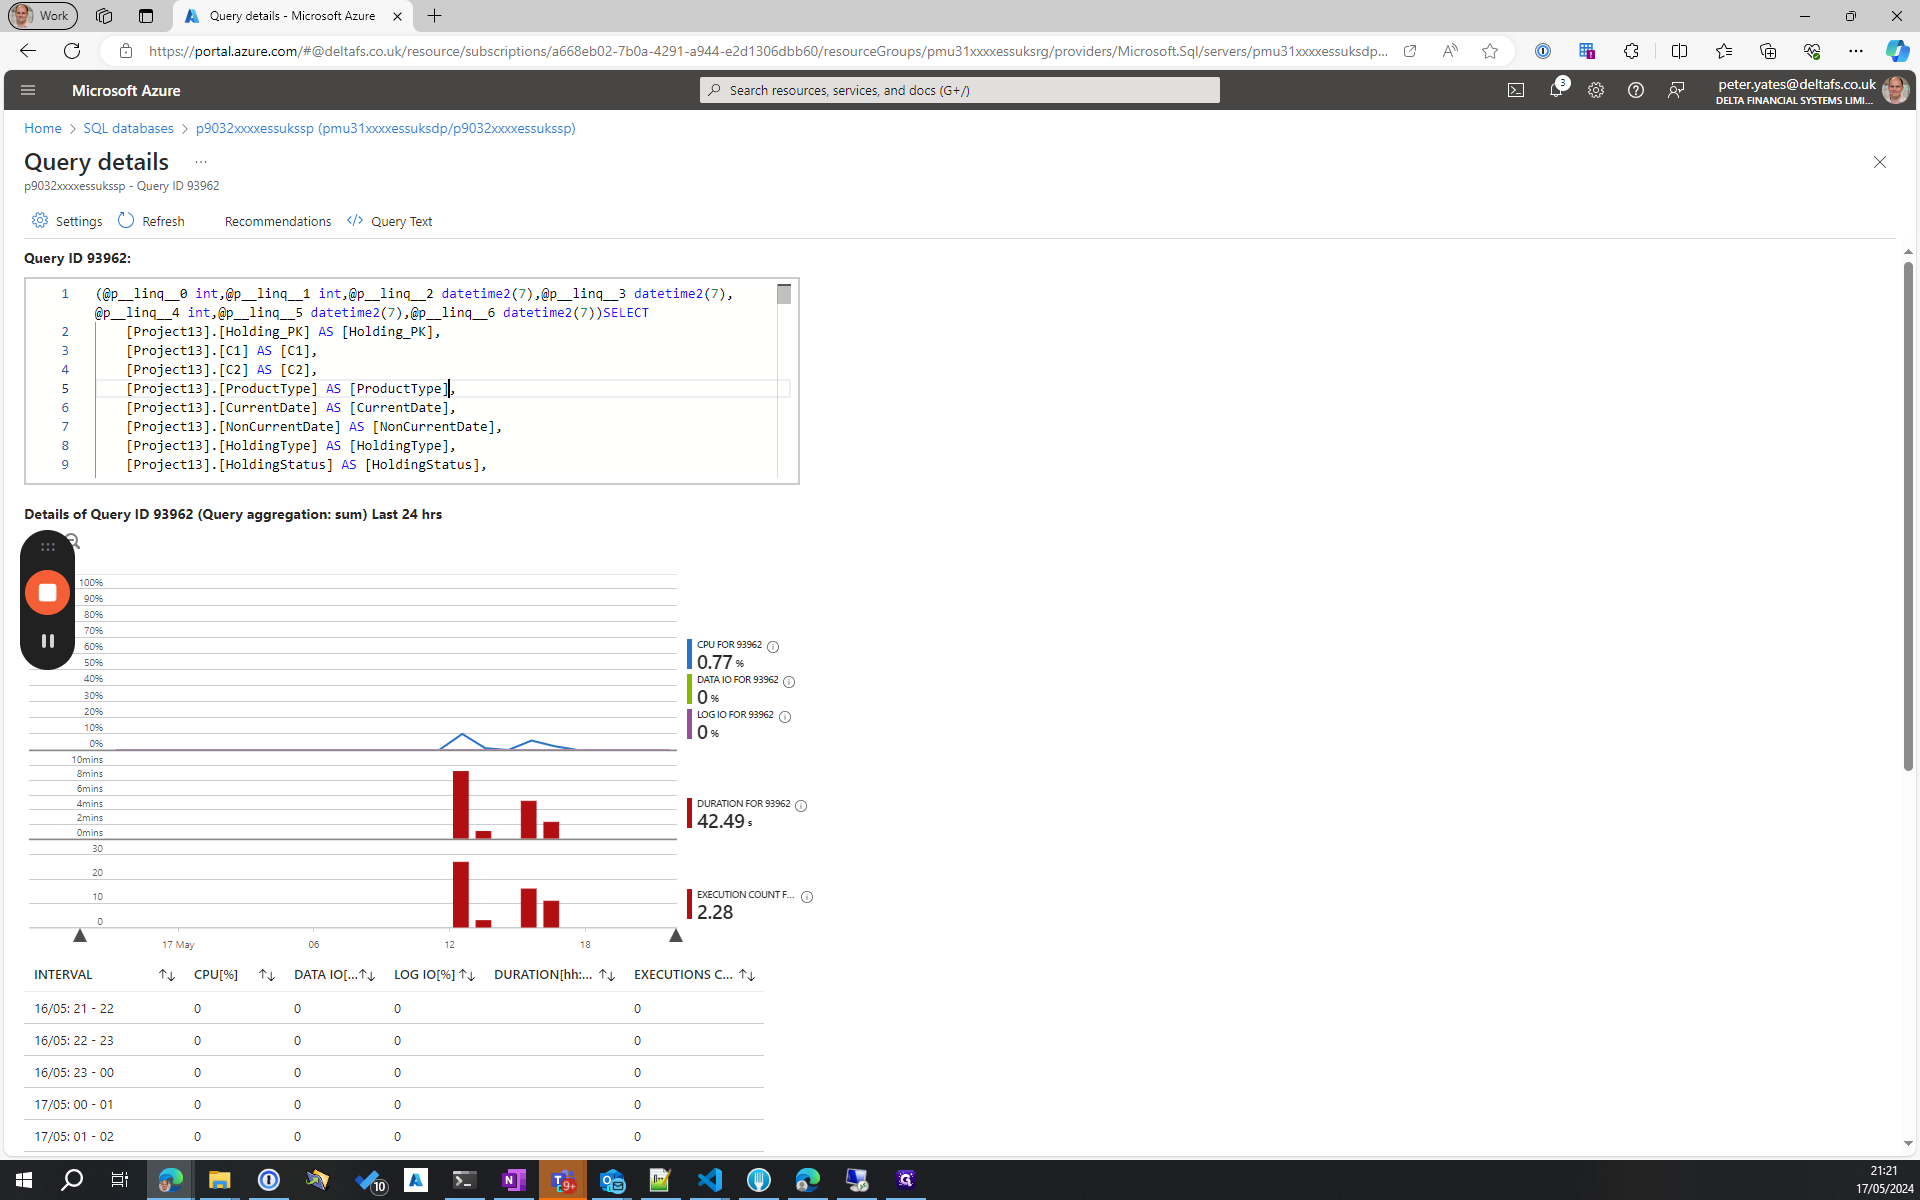

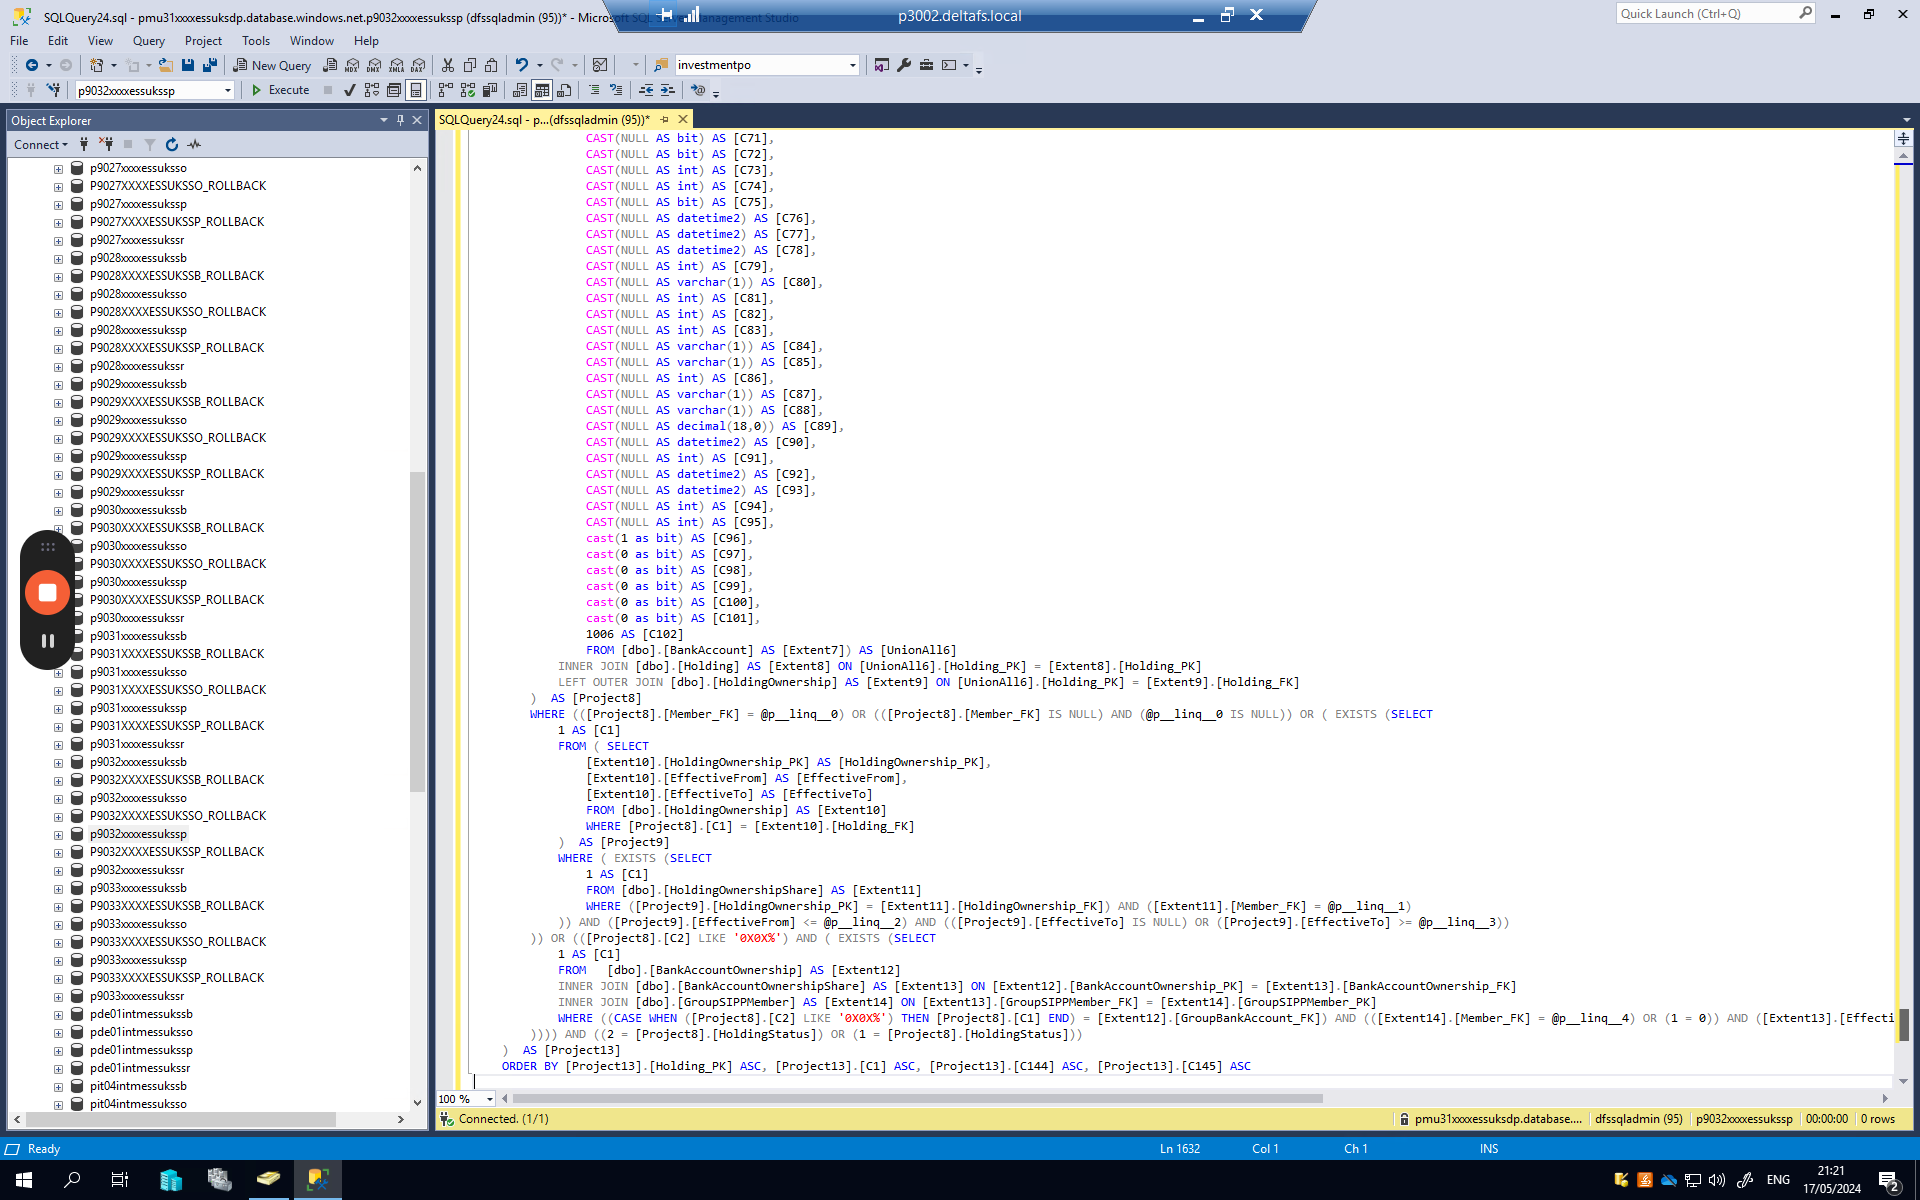
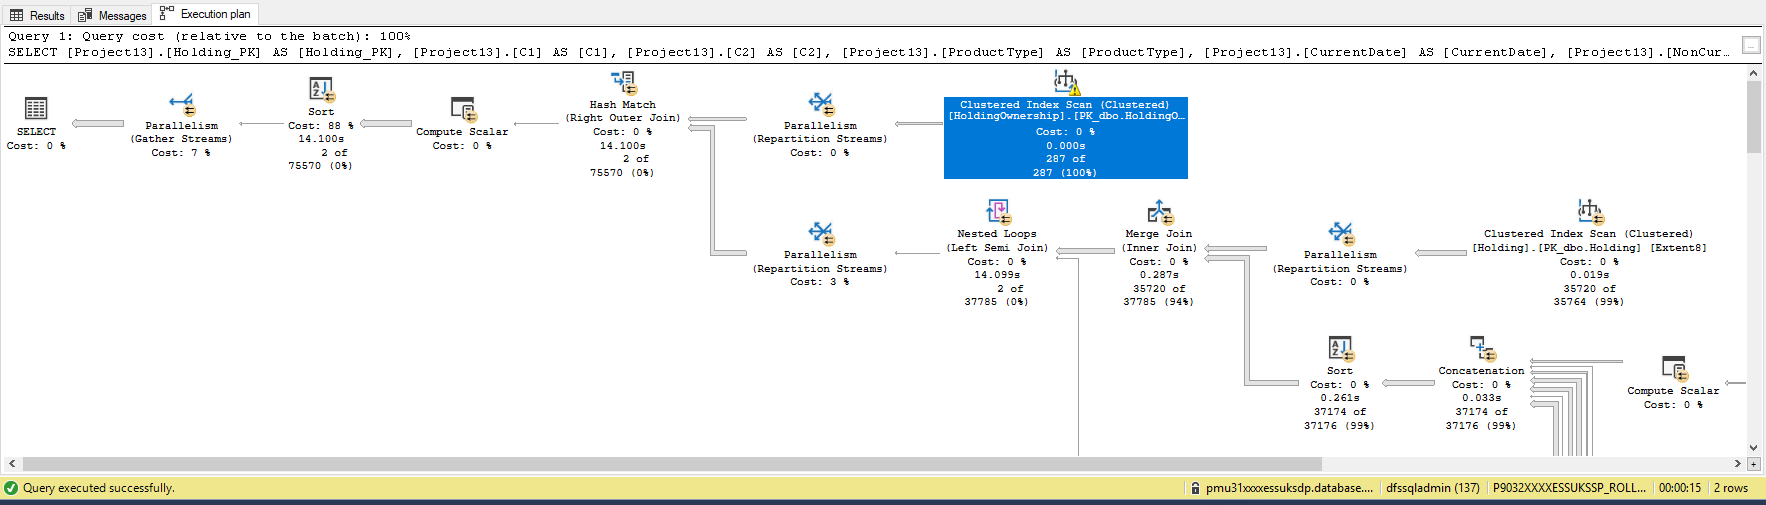
As you'll see, this will then take 12 seconds, as you can see at the very bottom of the screen. Normally, this query would take a second or so. If I click this button for "include actual execution plan" and then run it again, it will show me the execution plan, which might reveal performance issues.
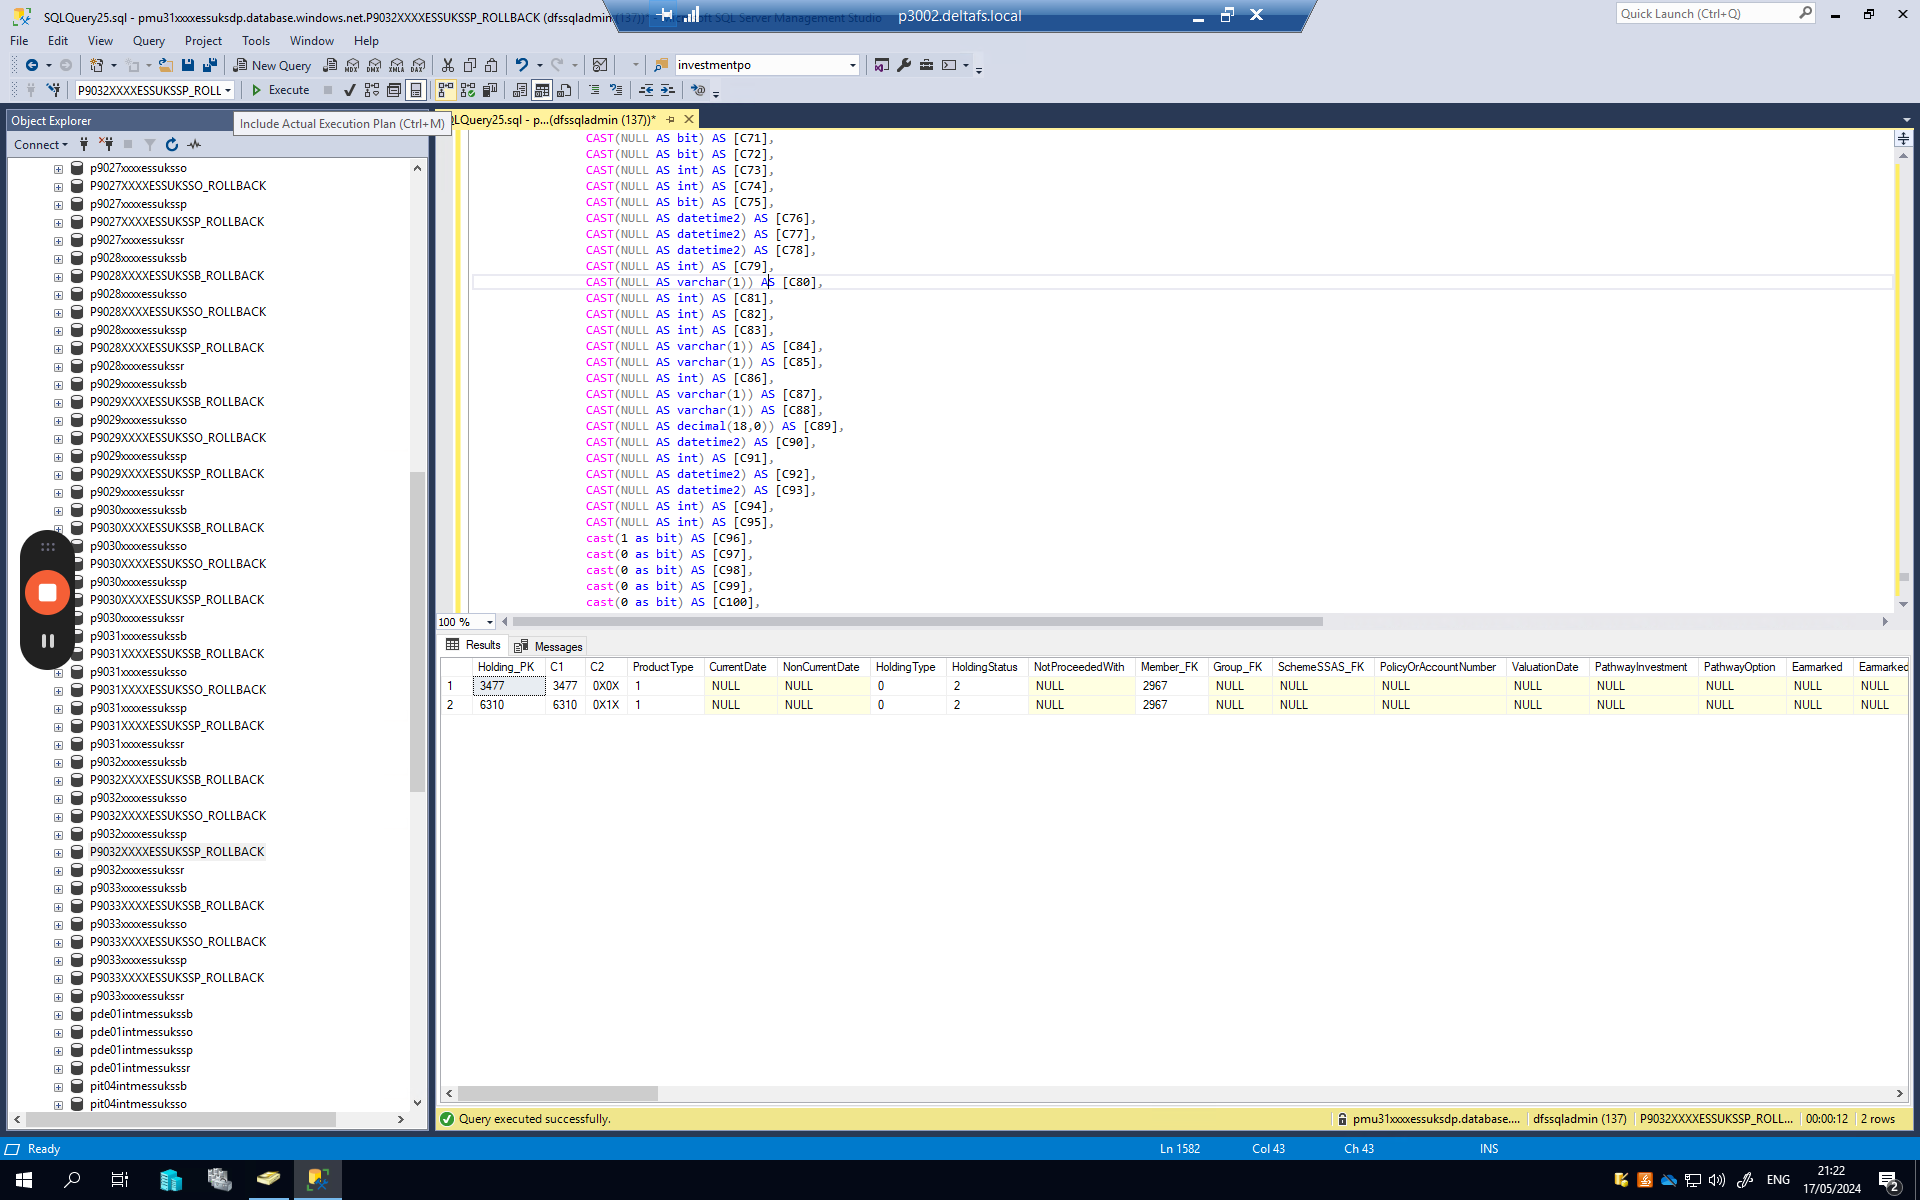
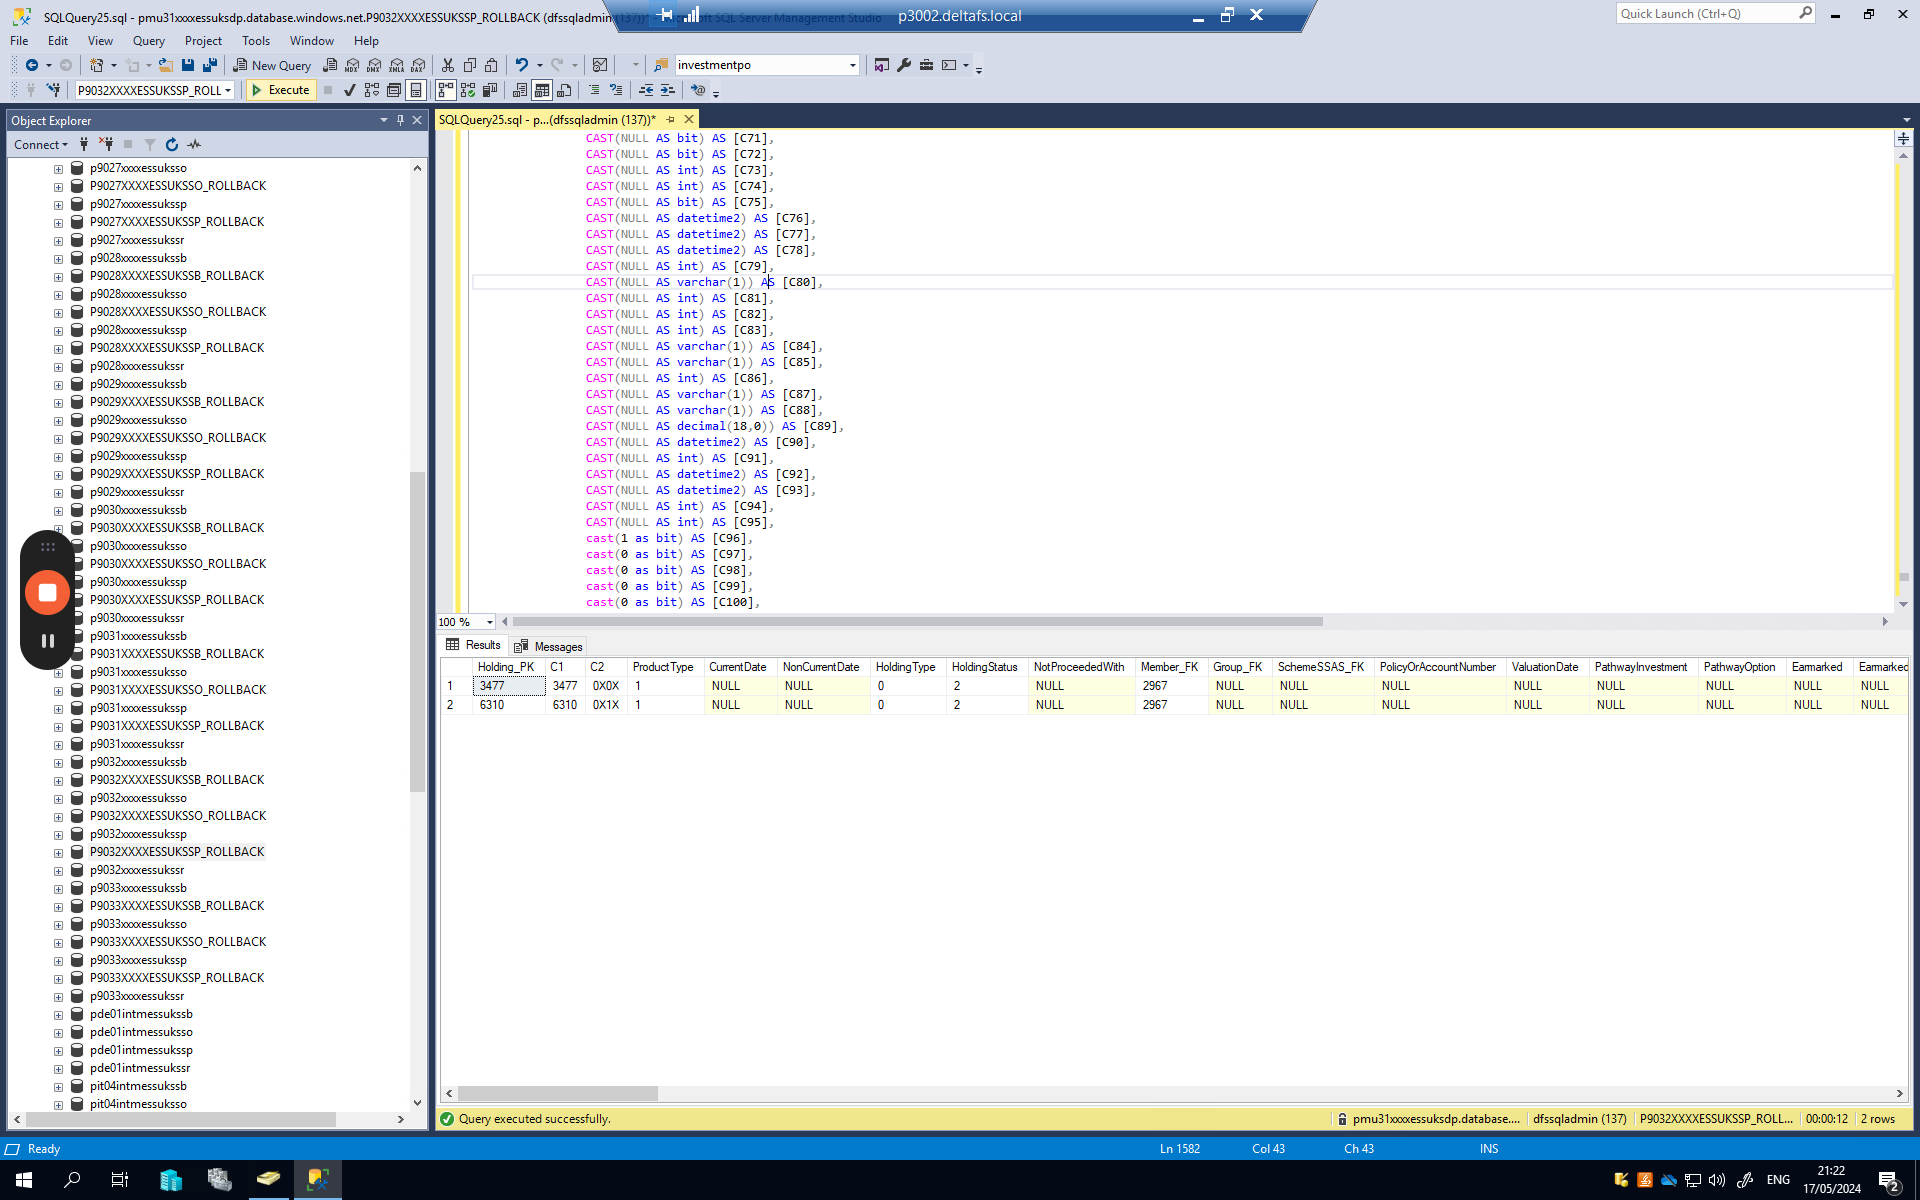
Results have appeared. Here's the execution plan, located in another tab.
In this case, we are focusing on the warning signs displayed here. There is a yellow triangle indicating a warning. If you hover over the triangle, it states: "Columns with no statistics." This identifies the problem with the database.
Thank you.